Graphing

How to Draw Mario on the TI-Nspire

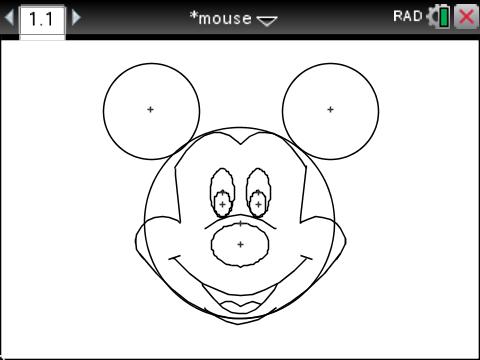
A few months back I had some time on my hands and did a post on how to graph Mickey Mouse with the TI-Nspire. Today I found myself in the same situation and decided to try my hand with the classic Nintendo character Mario on the Nspire. I imposed the same rules on myself as before, the goal was to plot using only functions/equations/relations available on the Nspire’s graphing menu and restricted domains.

Continue reading

TI-Nspire Graphing Art Mickey Mouse

Back when I was a Pre-Calculus teacher, one of the projects I used to assign during our conic sections unit was creating an art project out of equations, using circles, ellipses, lines, etc, and restricting their domains. It’s a fun way to reinforce how the various parameters for these equations influence the shape of their respective graphs. We did this on graphing paper, and told the students they could check a few things with their calculators if they wanted, but in recent years, the TI-Nspire CX (review) operating system has come a long way.

Continue reading

TI-Nspire OS 3.2 Demo

I’m going to have stories continuing to trickle out of my time at T3 in Chicago for a while. Along with the announcement of Mayim Bialik as their new spokesperson, the folks at TI had another big announcement, TI-Nspire OS 3.2 is on the way. There are three very noteworthy improvements that come with OS 3.2. First, graphing with conic sections is finally available. This is one of the few remaining things that was fairly simple to do on the TI-84 (via an app) but impossible on the TI-Nspire.

Continue reading

Video lesson: Finding the intersection of two graphs on the TI-Nspire

In this video lesson, you’ll learn how to find the intersection of two graphs on the TI-Nspire graphing calculator. The two functions graphed here are a line and parabola, but you could use this same approach for the intersection of two lines, or virtually any functions the TI-Nspire can graph. It’s also certainly possible to have more than two functions graphed at a time. You just have to let the Nspire know which two functions you are trying to find the intersection of.

Continue reading

Video lesson: Finding the intersection of two graphs on the TI-84

In this video lesson, you’ll learn how to find the intersection of two graphs on the TI-84+ graphing calculator. The two functions graphed here are a line and parabola, but you could use this same approach for the intersection of two lines, or virtually any functions the TI-84 can graph. It’s also certainly possible to have more than two functions graphed at a time. You just have to let the 84 know which two functions you are trying to find the intersection of.

Continue reading

Video lesson: Basic graphing features of the TI-84

This video lesson covers and introduction to graphing on the TI-84+. Inputting equations, tracing functions, and adjusting the graph window, and using zoom features are all explained.

Continue reading